

Analytics Dashboards (Widgets)
Dashboards allow you to create custom analytics views using company-wide data from the Global Analytics overview. Each dashboard is a customizable grid of widgets designed to track specific metrics or organize analytics by categories such as priority, test type, or milestones.
Dashboards operate at the Company level, aggregating test data across all projects in the selected company.
Create a Dashboard
Section titled “Create a Dashboard”To create a new dashboard:
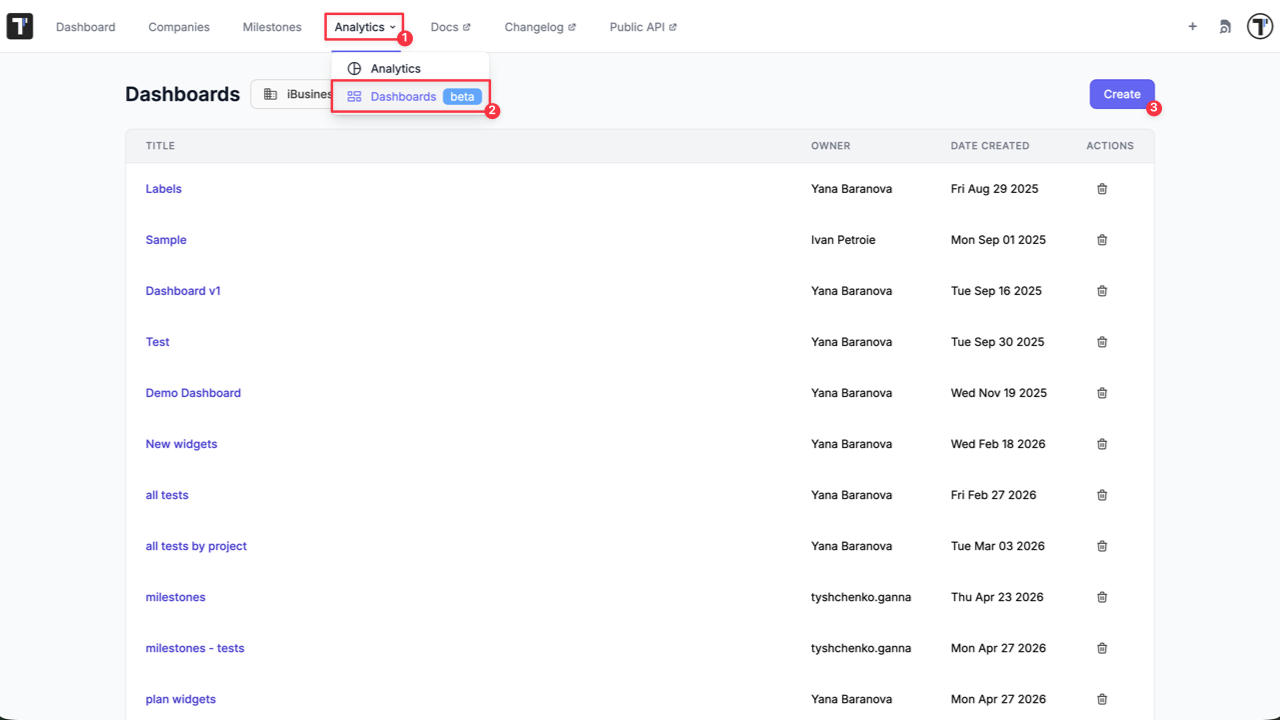
- Navigate to Analytics tab from the main workspace dashboard.
- Select Dashboards option from the displayed dropdown list.
- Click Create button to create a new dashboard.
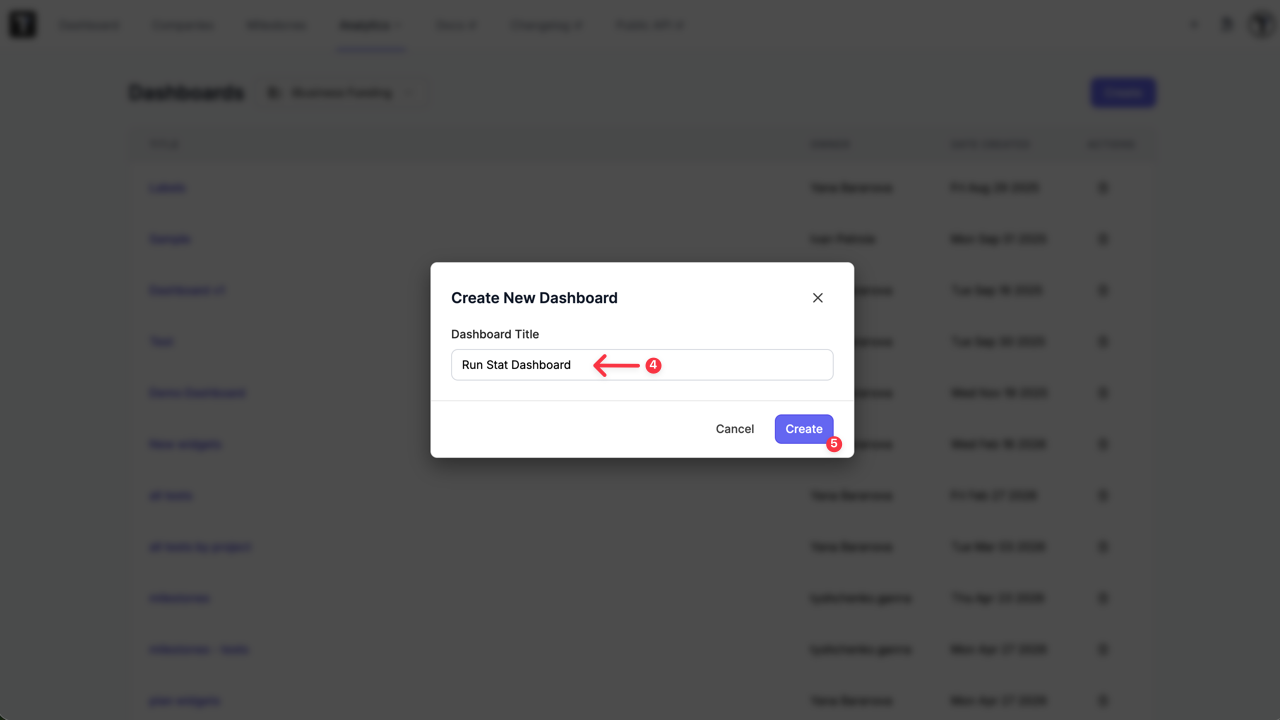
- Enter dashboard title in the displayed modal.
- Click Create button.
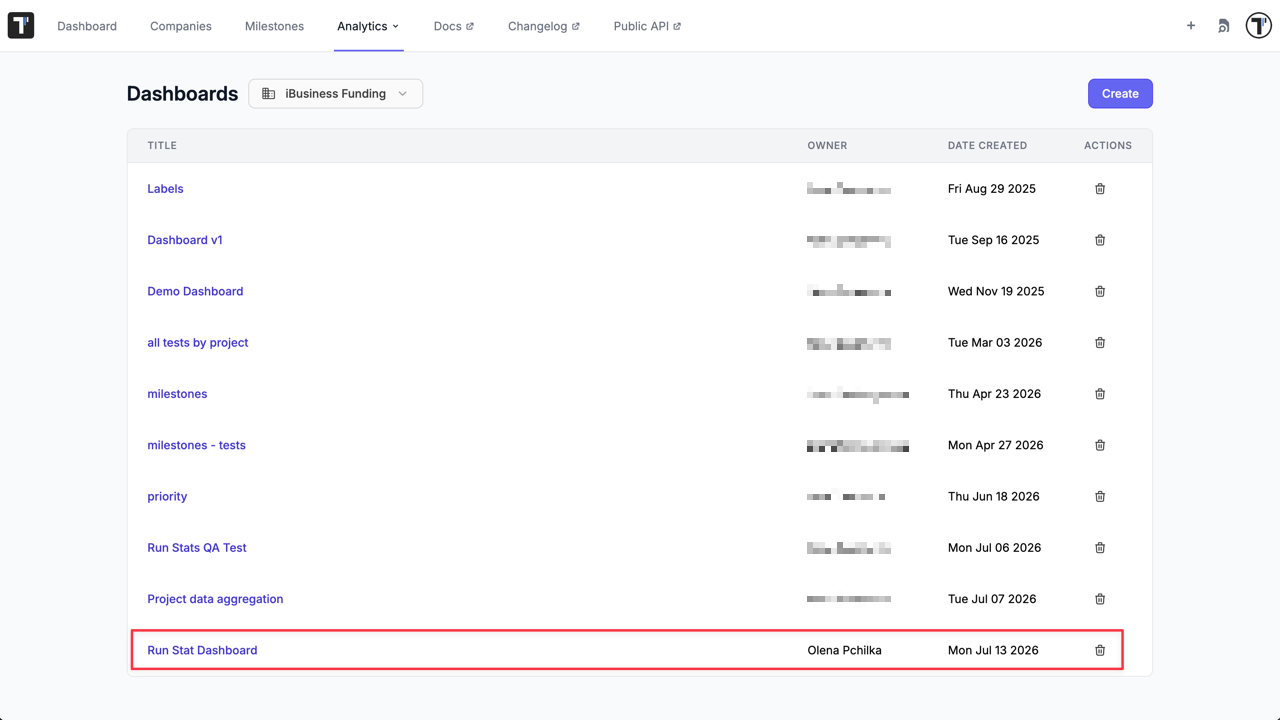
An empty dashboard page will be created and added to your dashboard list. You can now begin adding widgets tailored to your tracking goals.
The user who creates a dashboard is designated as its owner. Since dashboards belong to the company, all members with access to the company can view them.
Add the Widget
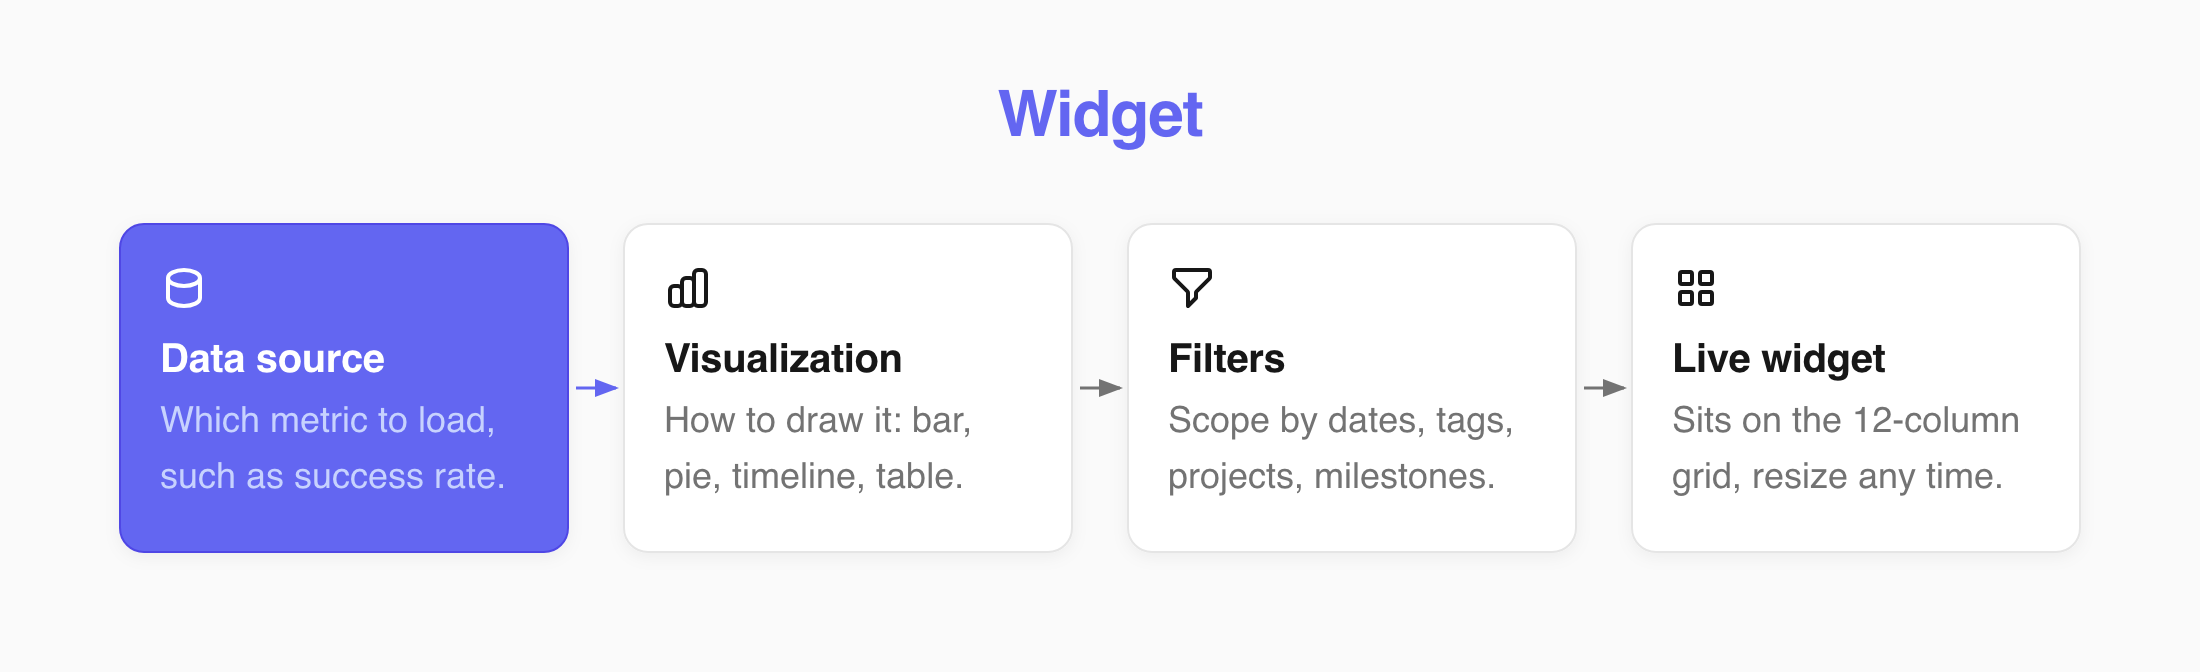
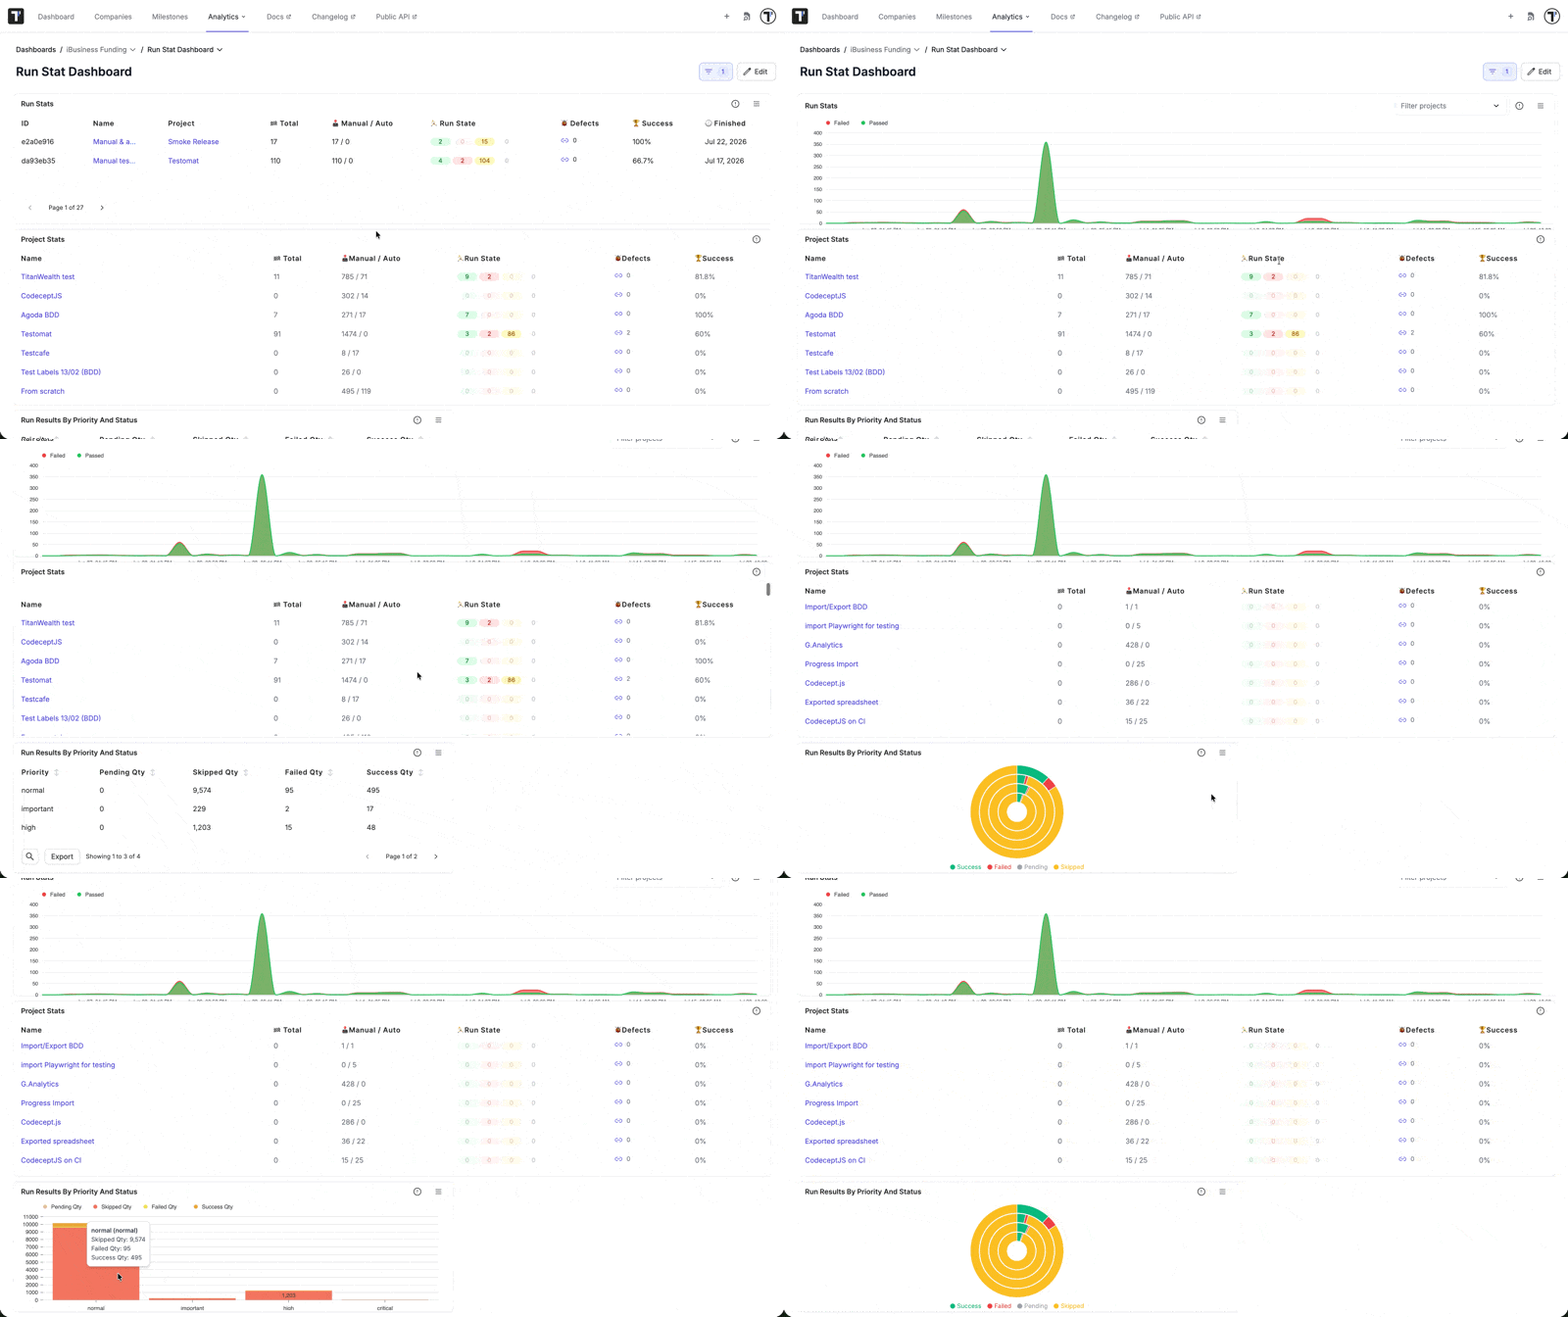
Section titled “Add the Widget”A widget is built based on two parameters: a data source that decides which metric to load, and a visualization that decides how to draw it. The same data source can be rendered in multiple chart styles. For example, success rate by date works as a bar chart, a timeline, or a table.
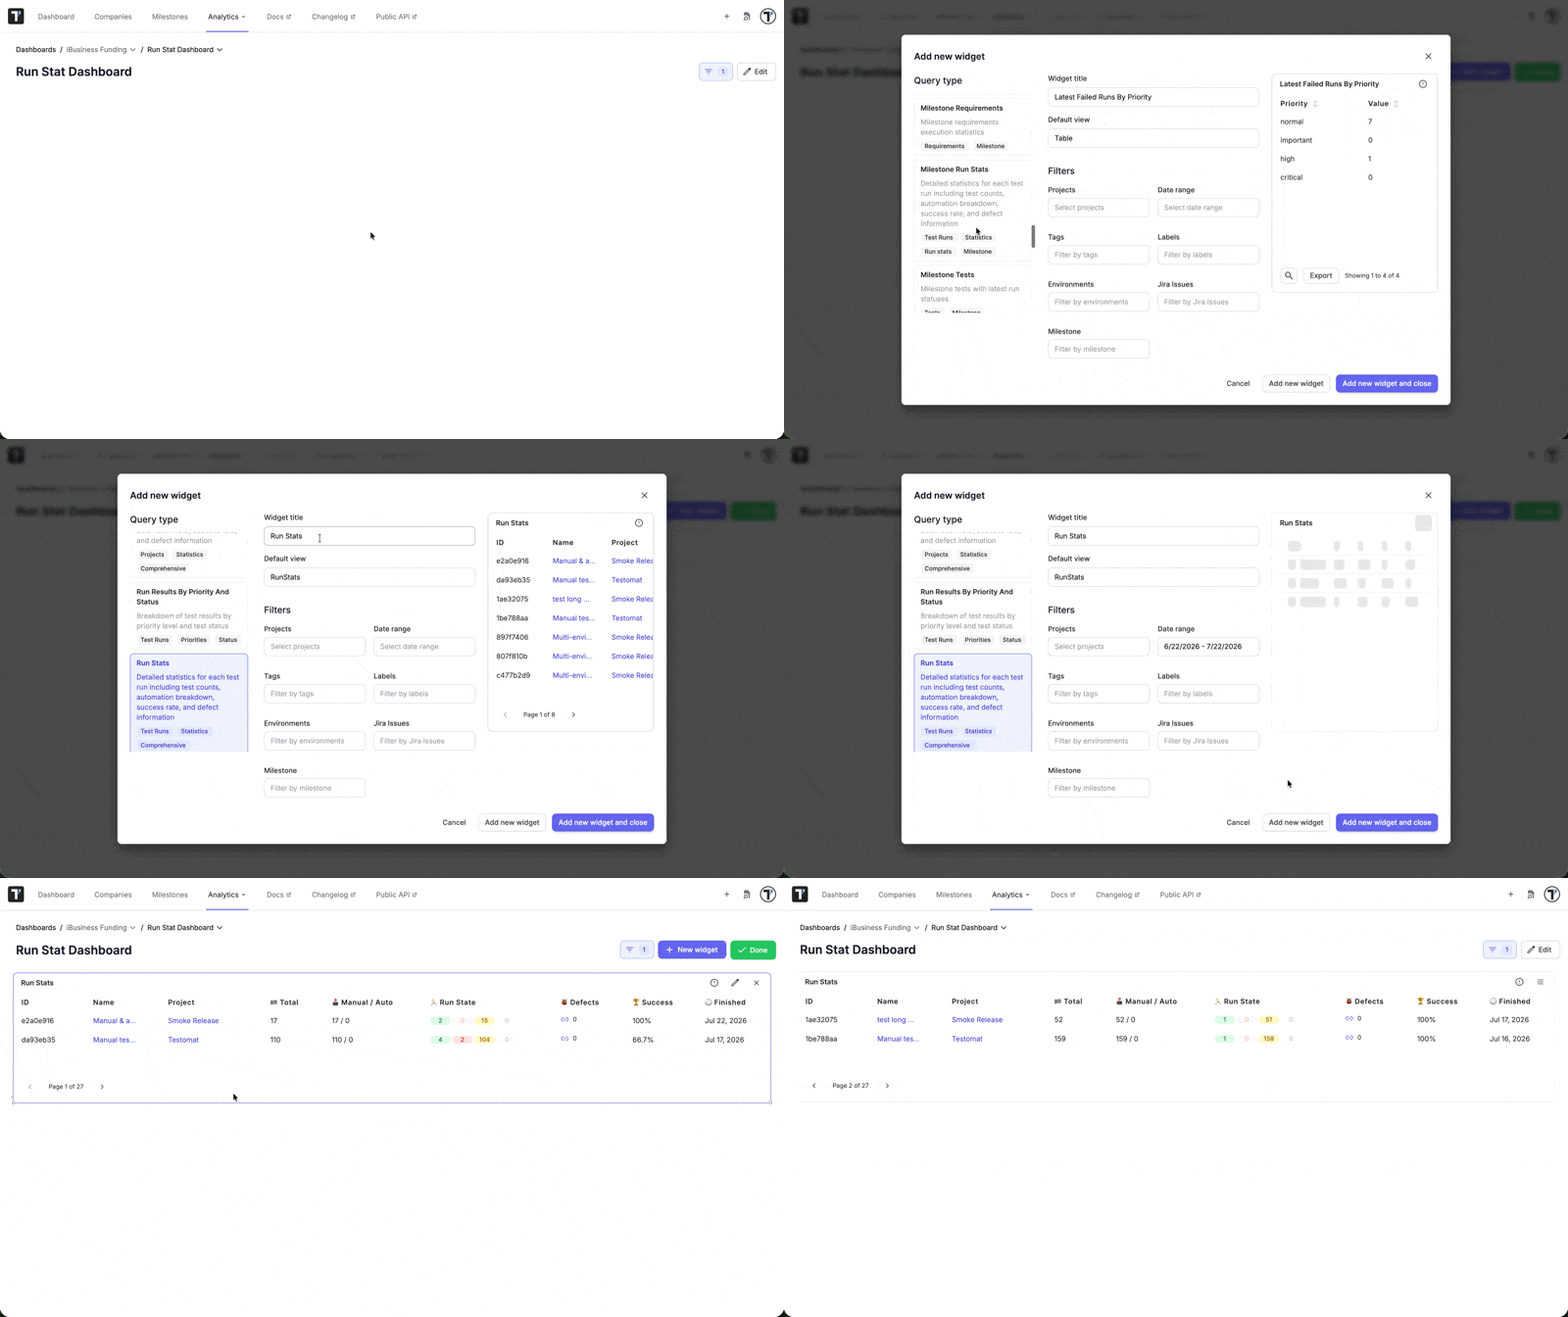
To add a widget:
- Open your dashboard page, click the Edit button.
- Click Add Widget button.
- Choose a Data Source. Each option includes a short description and a list of compatible visualizations.
- Select your preferred Visualization type
- Enter a Widget Title (not required).
- Save the widget. It appears on the grid and loads its data.
Widget Visualizations
Section titled “Widget Visualizations”Each data source supports a subset of different visualizations. The form shows only the ones that fit the data you picked.
| Visualization | What it shows |
|---|---|
| Single value | One headline number, such as total automated tests. |
| Bar chart / multi-bar chart | Values compared across categories or projects. |
| Pie chart / multi-pie chart / circle (donut) chart | A breakdown as parts of a whole, such as passed, failed, and skipped. |
| Timeline | A metric plotted over time, to see trends. |
| Table | Raw rows, such as per-project or per-priority figures. |
| Project stats | A full card for one project: test counts, automation rate, success rate, and defects by priority. |
| Run stats | A summary of run outcomes. |
| Partial total | A progress indicator showing part of a total, such as executed versus planned. |
| Milestone views | Layouts for a milestone’s run stats, tests, plans, and requirements. |
Default Widget View
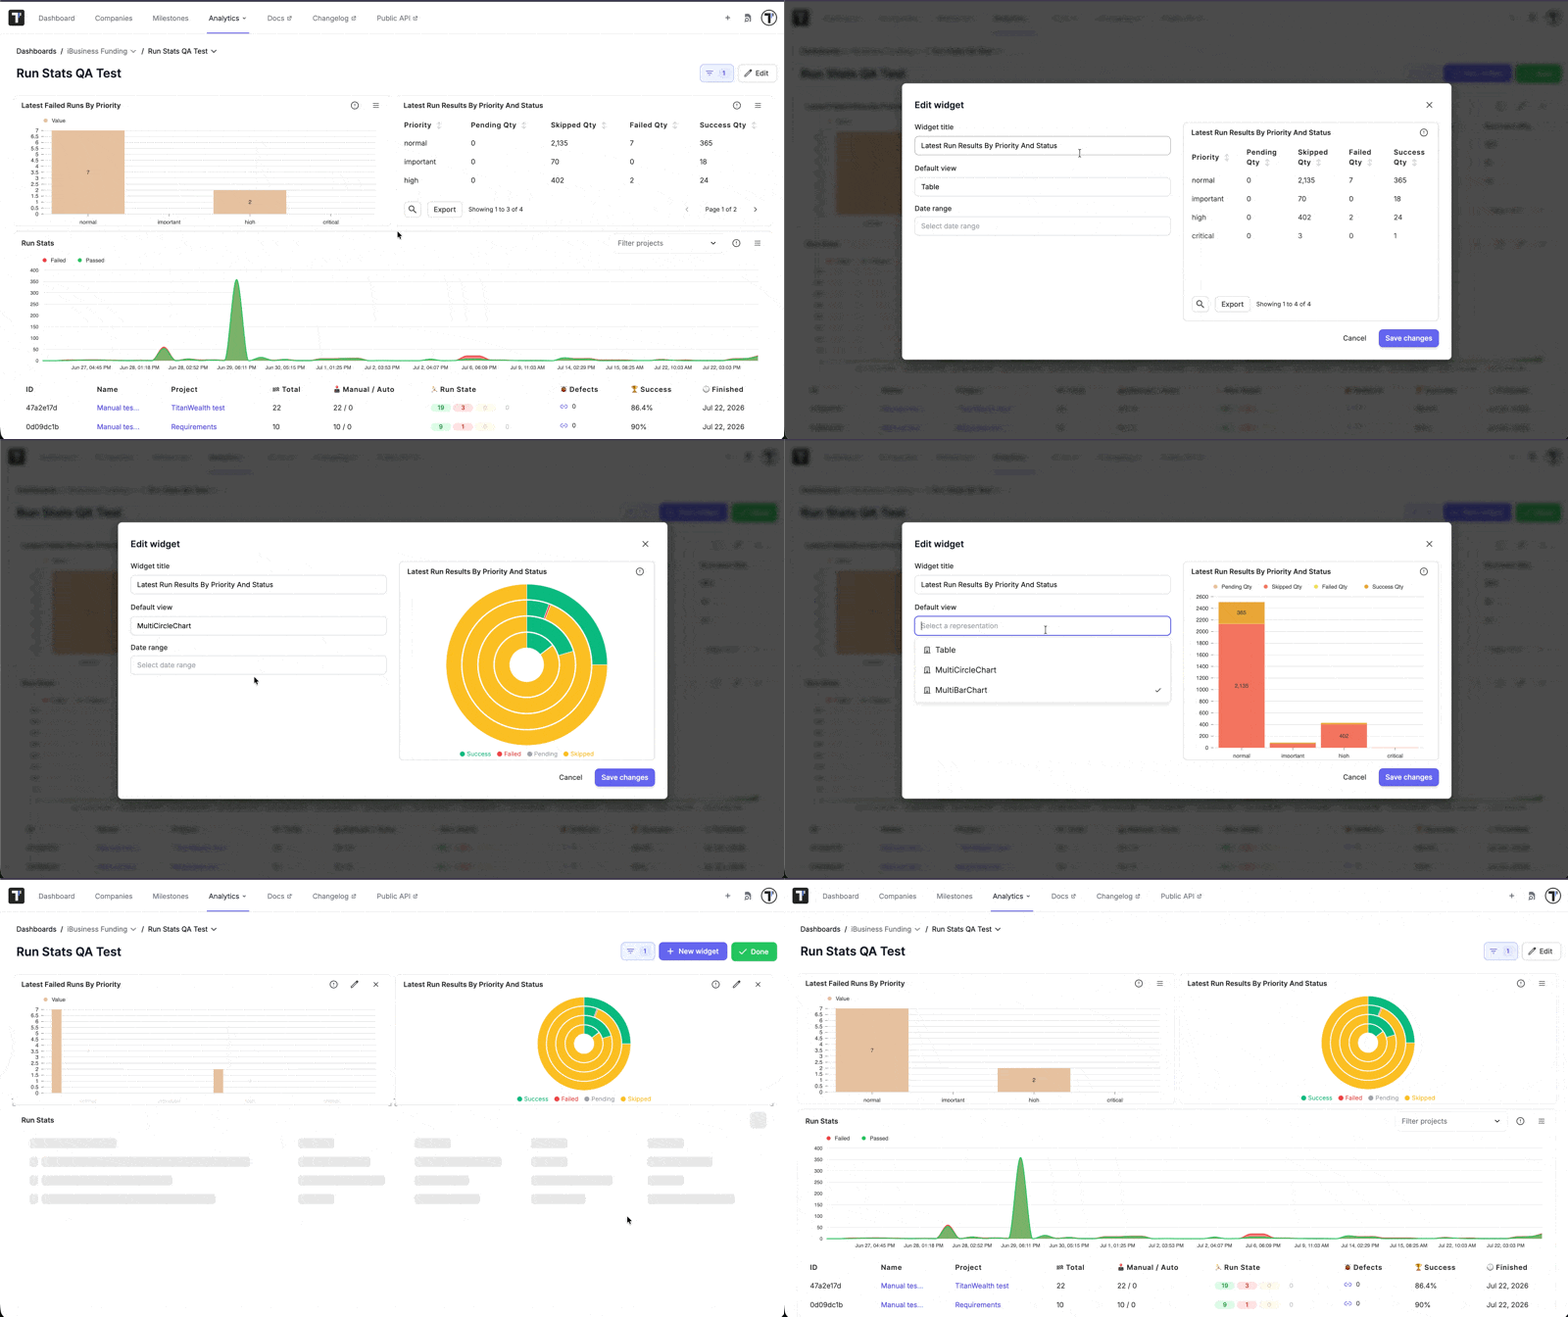
Section titled “Default Widget View”You can set or change the Default View for a widget in two ways:
- During widget creation: Choose the default view within the widget configuration modal.
OR
- After creation: Open Edit mode on the dashboard page and adjust the view directly on the widget card.
Available Data Sources
Section titled “Available Data Sources”Data sources fall into a few groups. Choose a data source based on the key metrics you need to analyze.
| Group | Data sources | Answers |
|---|---|---|
| Test counts | Automated tests, manual tests, all tests - each also available per project | How many tests exist and how automation is split |
| Run trends | Success rate by date, automation rate by date, test runs by date | How outcomes and automation change over |
| Priority and status | Run results by priority and status, failed runs by priority | Where failures concentrate by priority |
| Summaries | Project stats, run stats | A full picture of one project or run |
| Milestones | Milestone completion, milestone run stats, milestone tests, plans, and requirements | Progress against a milestone |
Edit Widgets Layouts
Section titled “Edit Widgets Layouts”Dashboards use a 12-column grid and it allows you to shape the layout directly on the page.
Customize the layout
- Click Edit on the dashboard page.
- Move: Click and drag a widget by its header.
- Resize: Drag the edges or corners of a widget.
- Click ‘Done’ to save your layout.
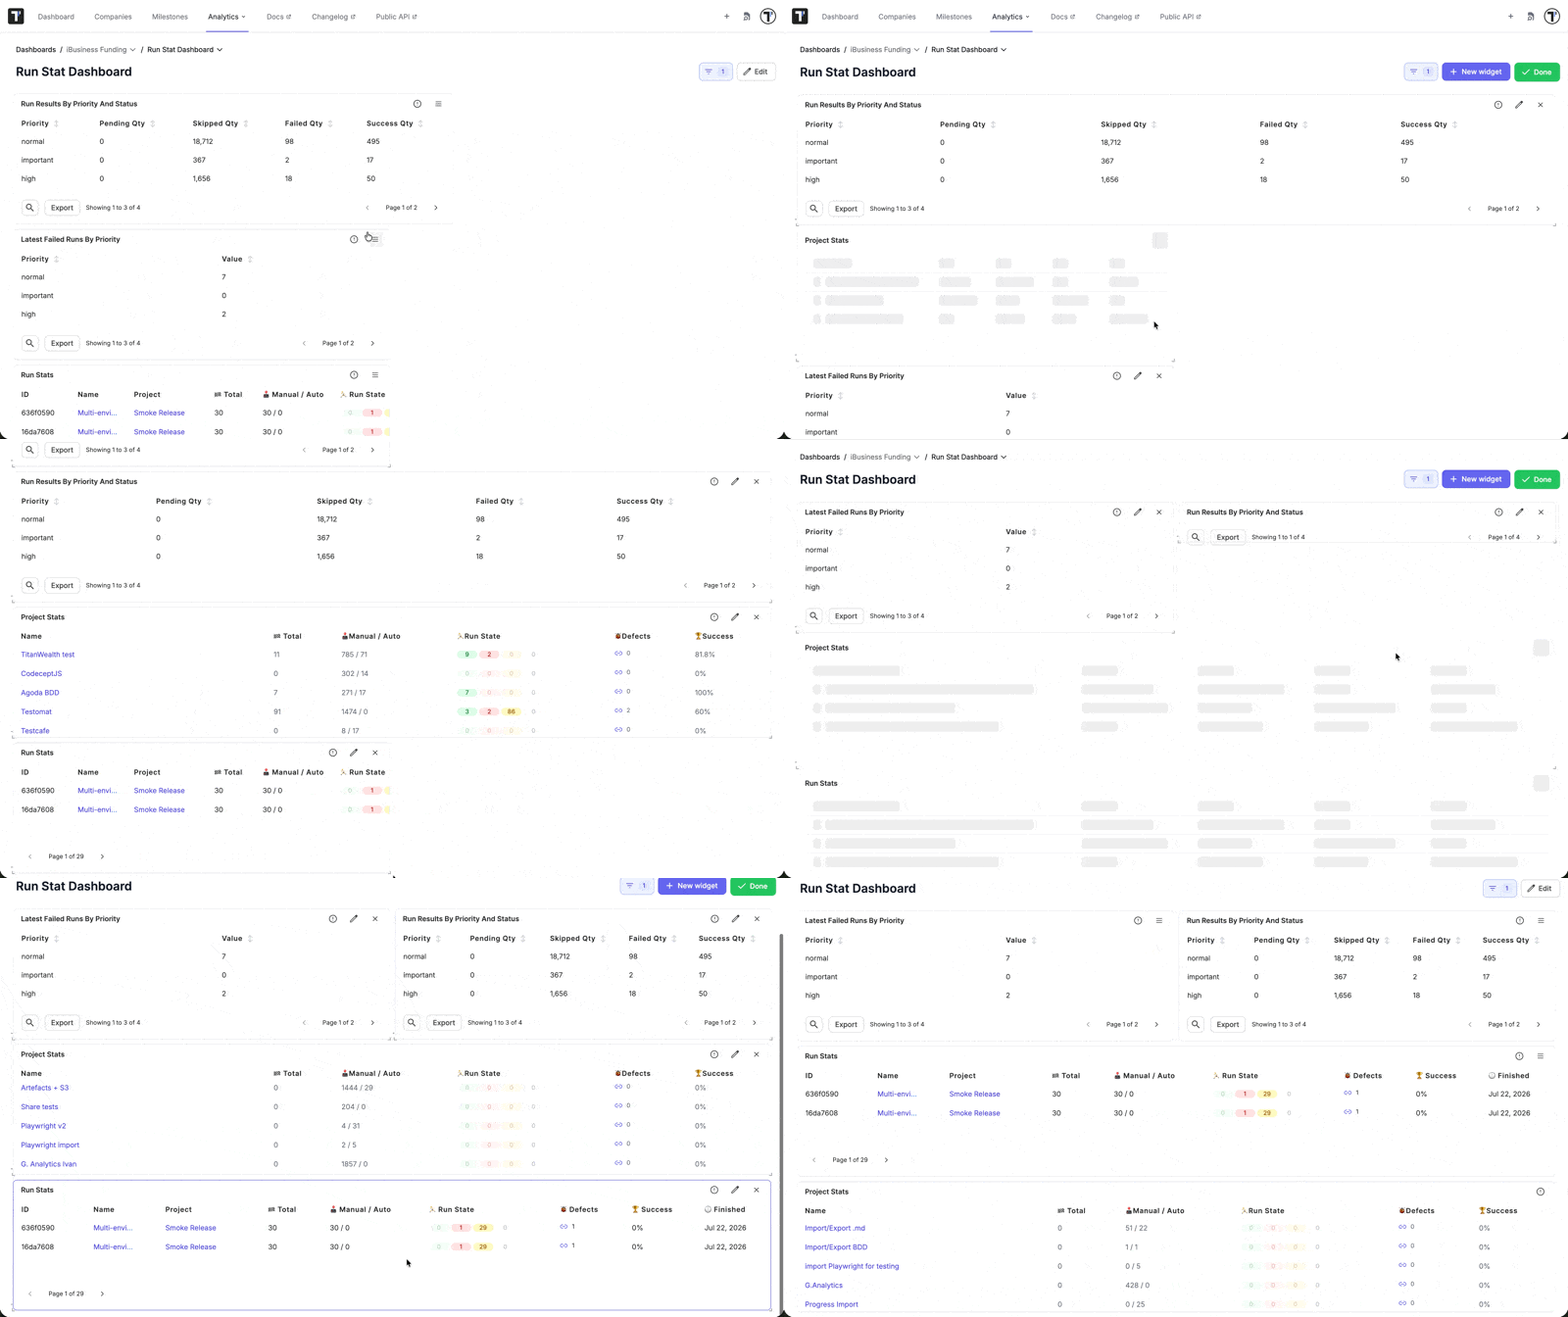
A widget can span from one column up to the full width of the grid, a wide trend chart and a narrow counter can sit on the same row.
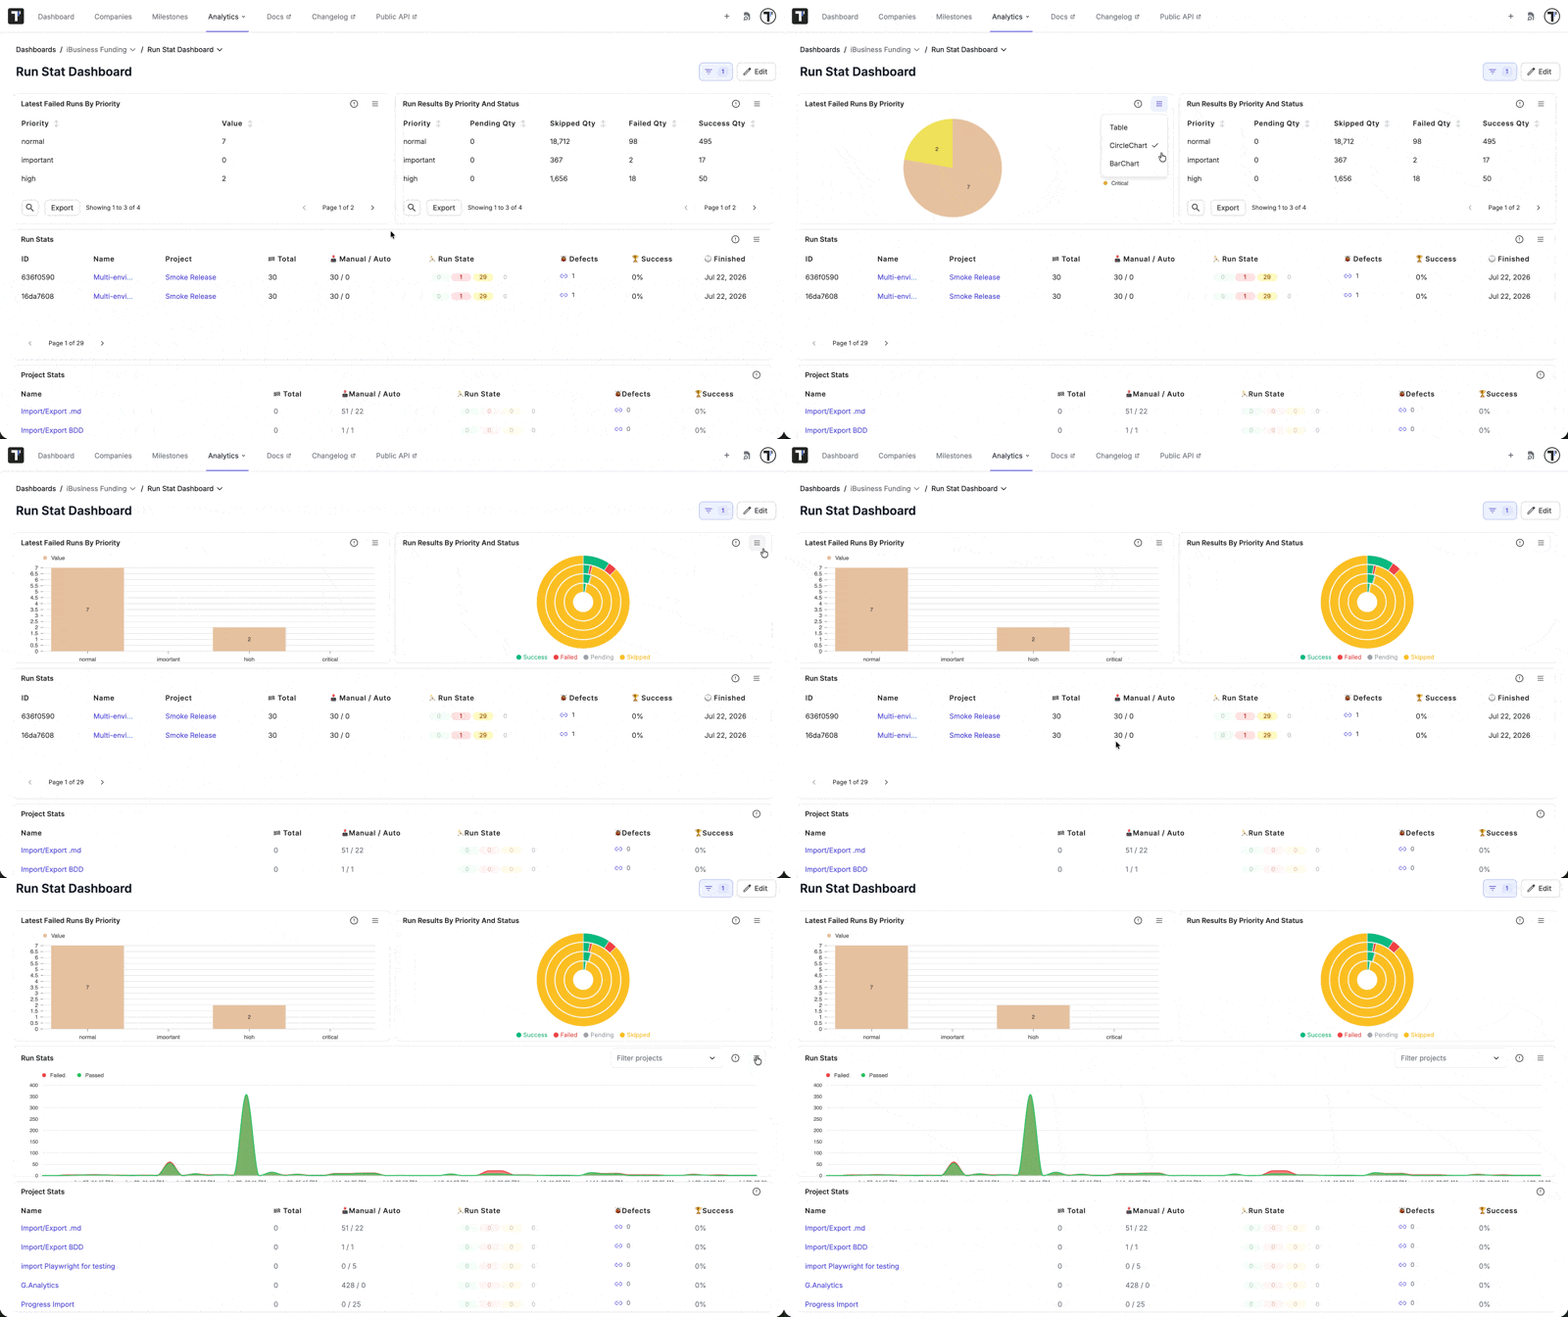
After saving the layout, you can quickly switch visualization types directly from the widget header options without entering full edit mode.
Filtering Analytics Data
Section titled “Filtering Analytics Data”Filters can be applied at the Dashboard level (affecting all widgets) or at the Widget level (affecting an individual widget).
Filter Criteria
Section titled “Filter Criteria”- Date range - restrict run-based metrics to a period.
- Projects - limit analytics to one or more projects in the company.
- Tags and labels - narrow to tests that carry a tag or a label value (e.g., @smoke, Priority: High).
- Environments - focus on a specific test environment (e.g., Staging, Production).
- Jira issues - focus on tests linked to specific issues.
- Suites and folders - limit to part of the test tree.
- Milestones - scope data to a milestone.
Available filter values (tags, labels, environments, suites) are dynamically populated from all accessible projects across your company.
Dashboard-Level Filters
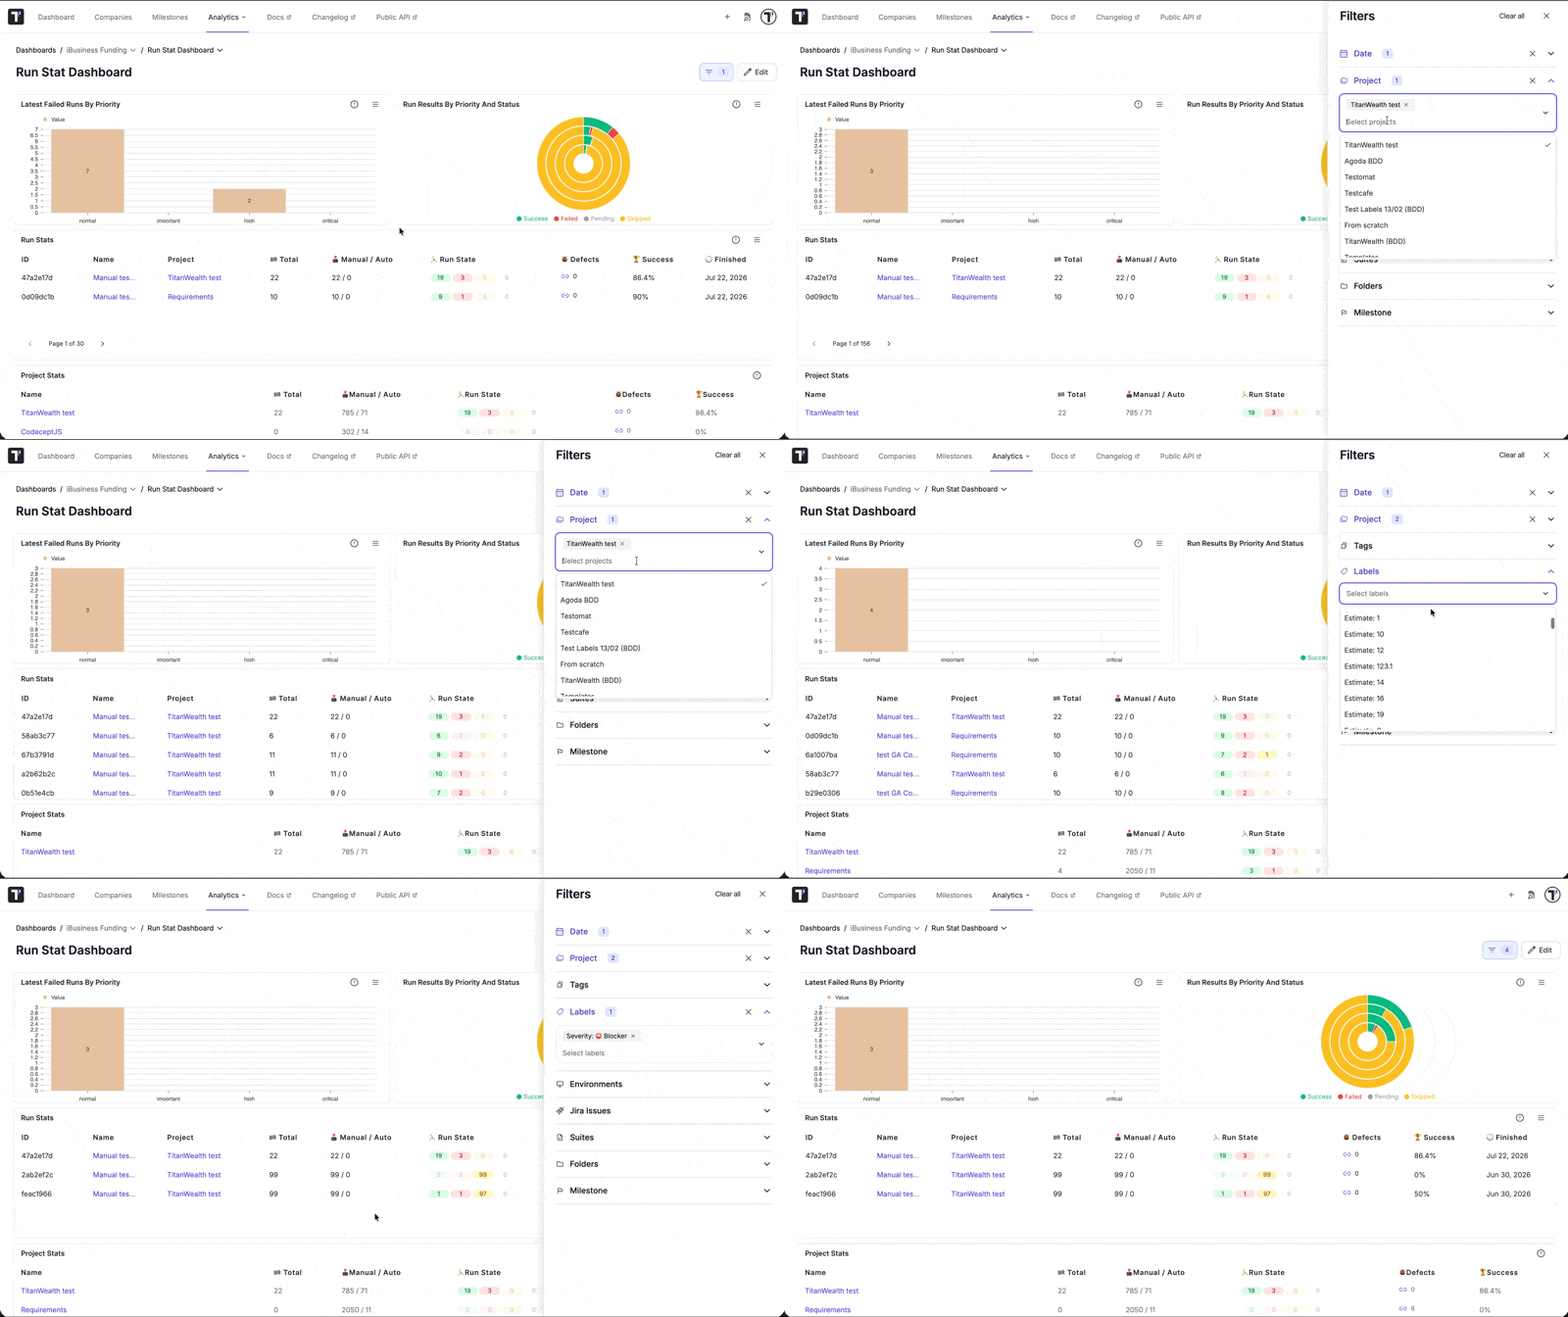
Section titled “Dashboard-Level Filters”- Click Filter icon in the top-right corner on the Dashboard page.
- Configure your filter criteria. The selected filters will instantly apply to all widgets on the board.
Single Widget Filters
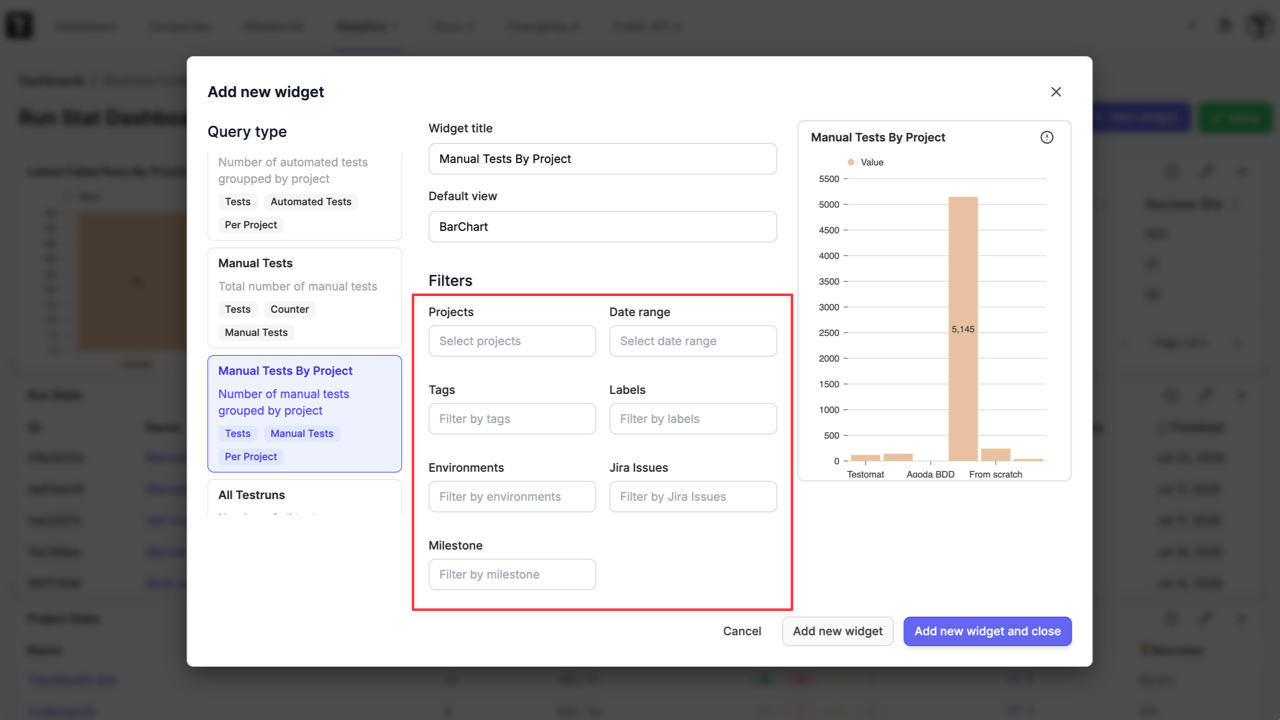
Section titled “Single Widget Filters”- Click Edit and then New widget.
- Select your data source and configure specific filters within the creation panel.
- Add the widget to your board.
On an Existing Widget (Date Filter)
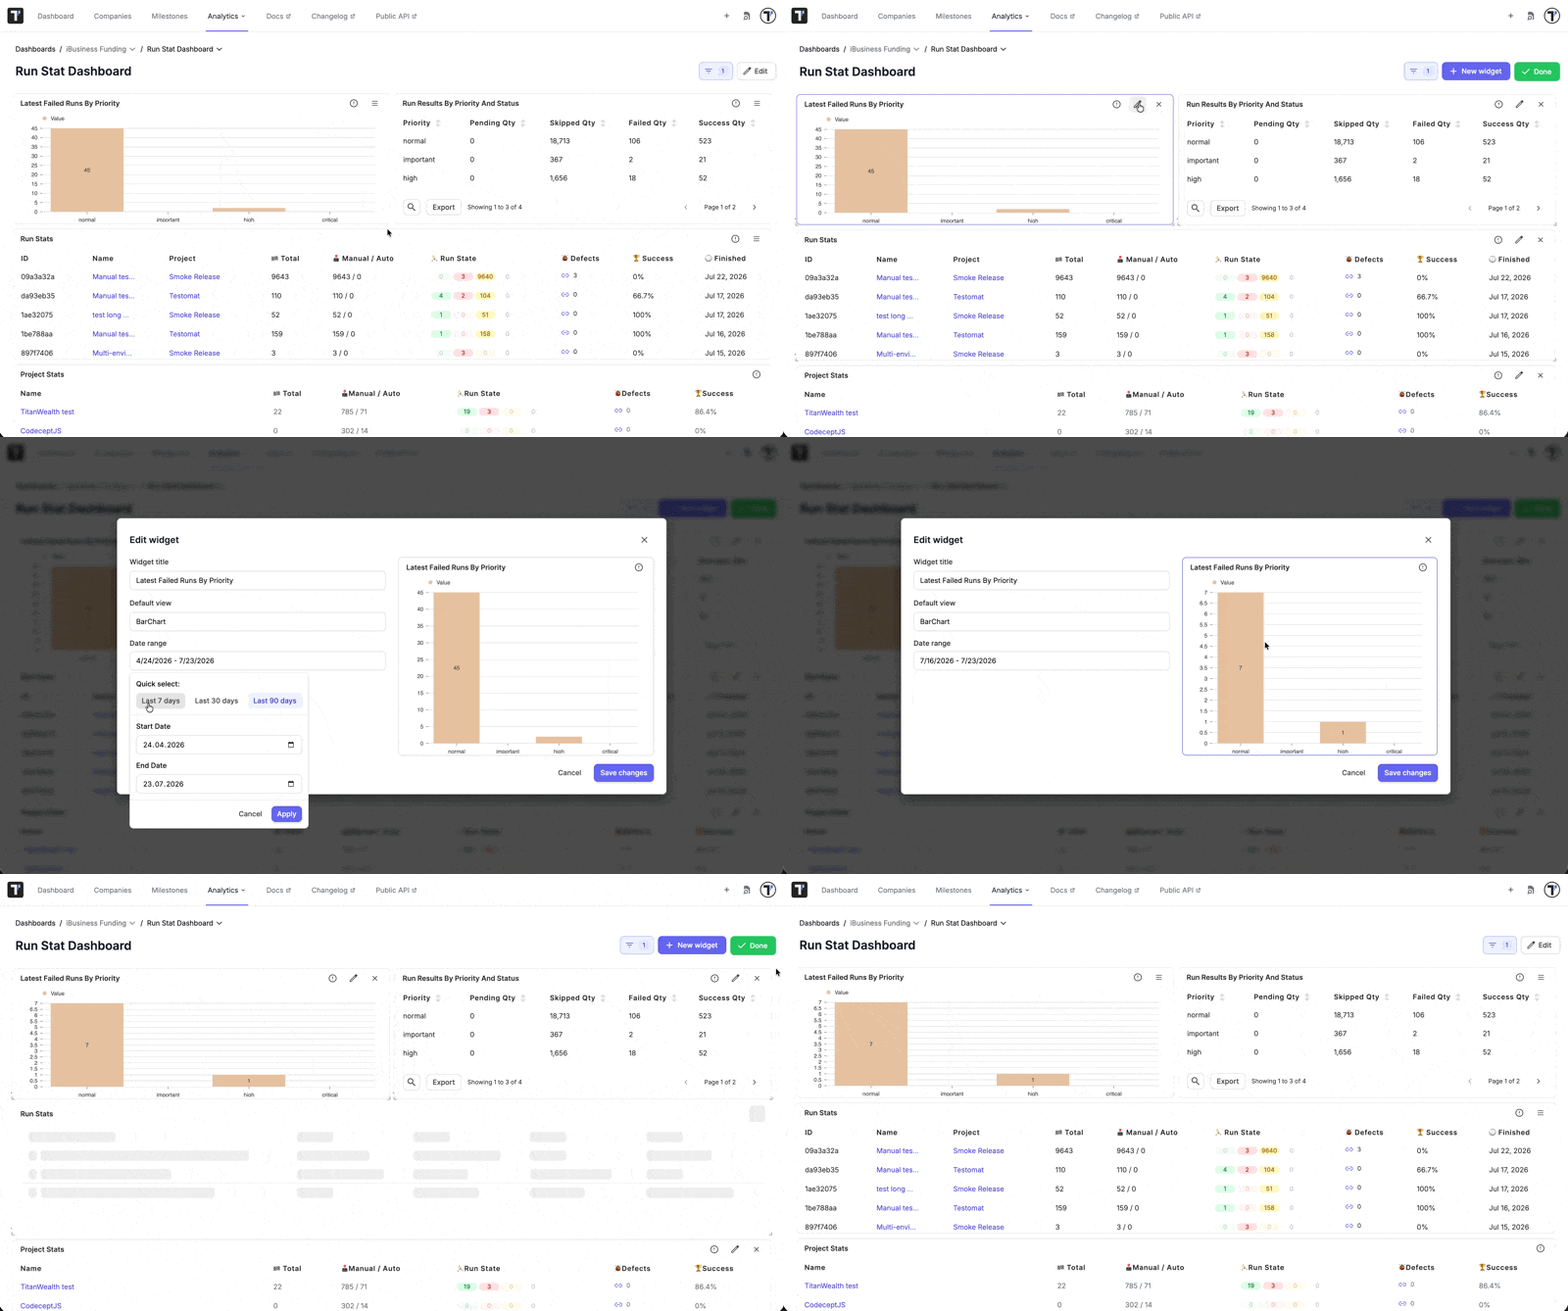
Section titled “On an Existing Widget (Date Filter)”- Click Edit in the top-right corner of the Dashboard page.
- Click the Edit (pencil) icon on the specific widget card.
- Adjust the date range filter.
- Save your changes.
Next Steps
Section titled “Next Steps”- Analytics Board - read the prebuilt company overview your widgets are built from.
- Milestones - group tests, plans, and runs into a milestone.
- Project Analytics - drill into a single project when a company-wide view is not enough.
- Tags or Labels - tag and label your tests.
- Users Roles & Access - check who can create and edit dashboards in your company.